Production Simulation

Project Description
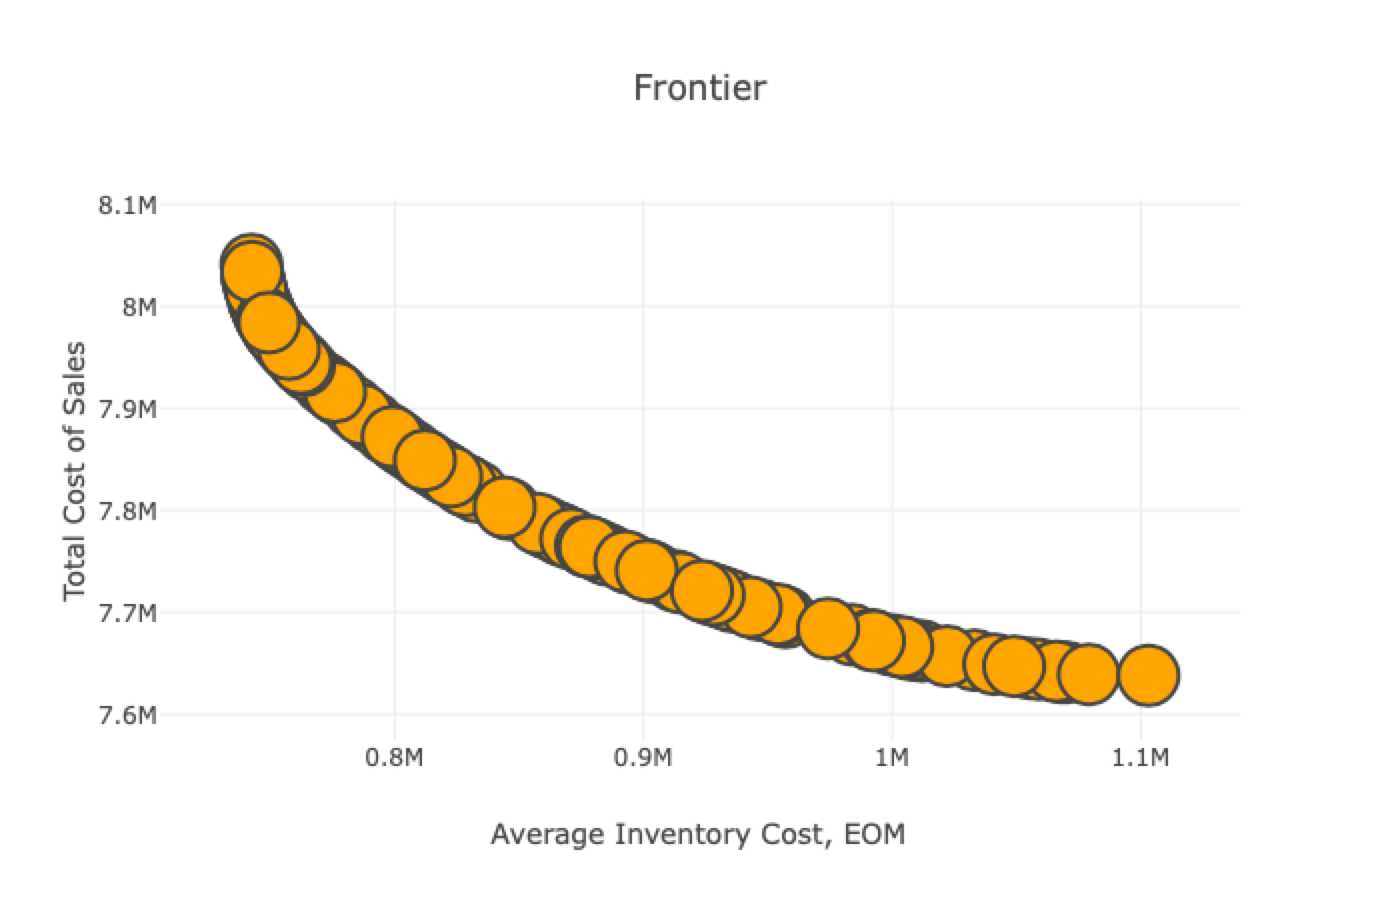
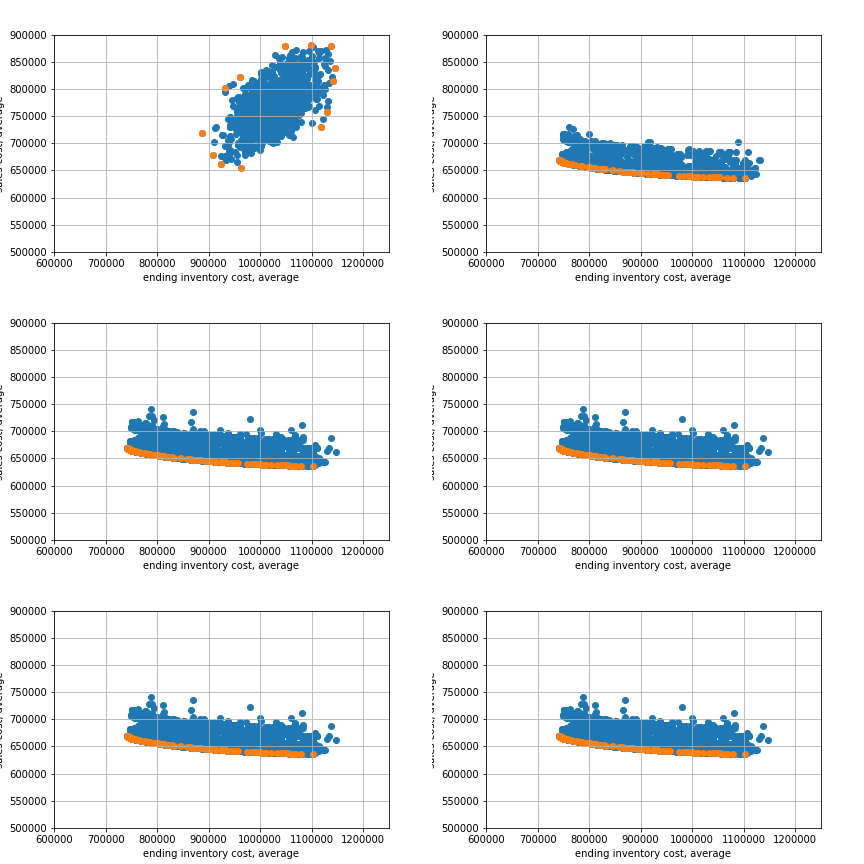
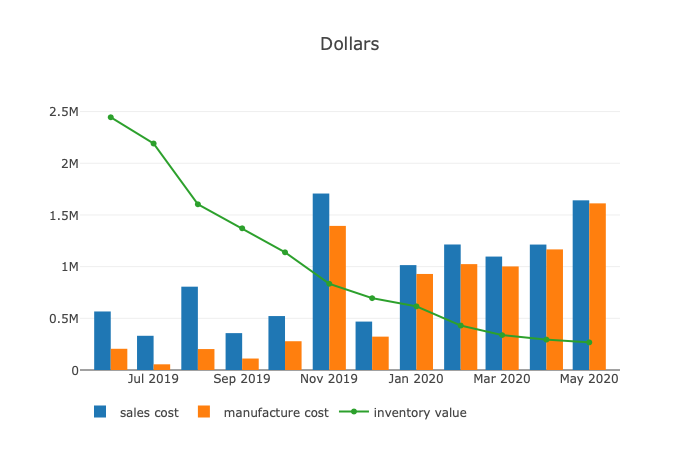
Each point on the curve represents one year of production, including all sales, manufacturing, and inventory flow. Reported scenarios show the optimized balance between manufacturing and carrying costs given constraints in warehouse space, manufacturing capacity, and monthly labor limits.
The Full Production Simulation takes into account the different decisions that can be made at a product level, and returns a series of manufacturing scenarios that optimize system resources on a product-by-product level. Maximize profits for a given working capital, minumize labor use, or test the effects of adding manufacturing capacity to the proforma financial statements.
Use Cases
- Determine which products to stock and which to manufacture-to-order
- Compare investment decisions in manufacturing capacity versus investment in warehouse space
- Process works on up to 10,000 unique SKU's


