Product Simulation

Project Description

Inventory that sits on the shelf costs incurs carrying costs that erode profits. Products that sit too long eventually become so expensive that they can never turn a profit. This app provides the working capital and profit profiles of different strategies, assisting managers in making an informed decision on when to discount, when to keep, and when to discard product.

Use it as a stand alone app or connect it to your ERP system (like Dynamics) to work with live data.

Use Cases

  • Compare discounting or run-out-inventory strategies
  • See effects of manufacturing strategy on profits and working capital
  • Compare before-and-after scenarios of capital improvements on cash flow
Insights

Card image cap
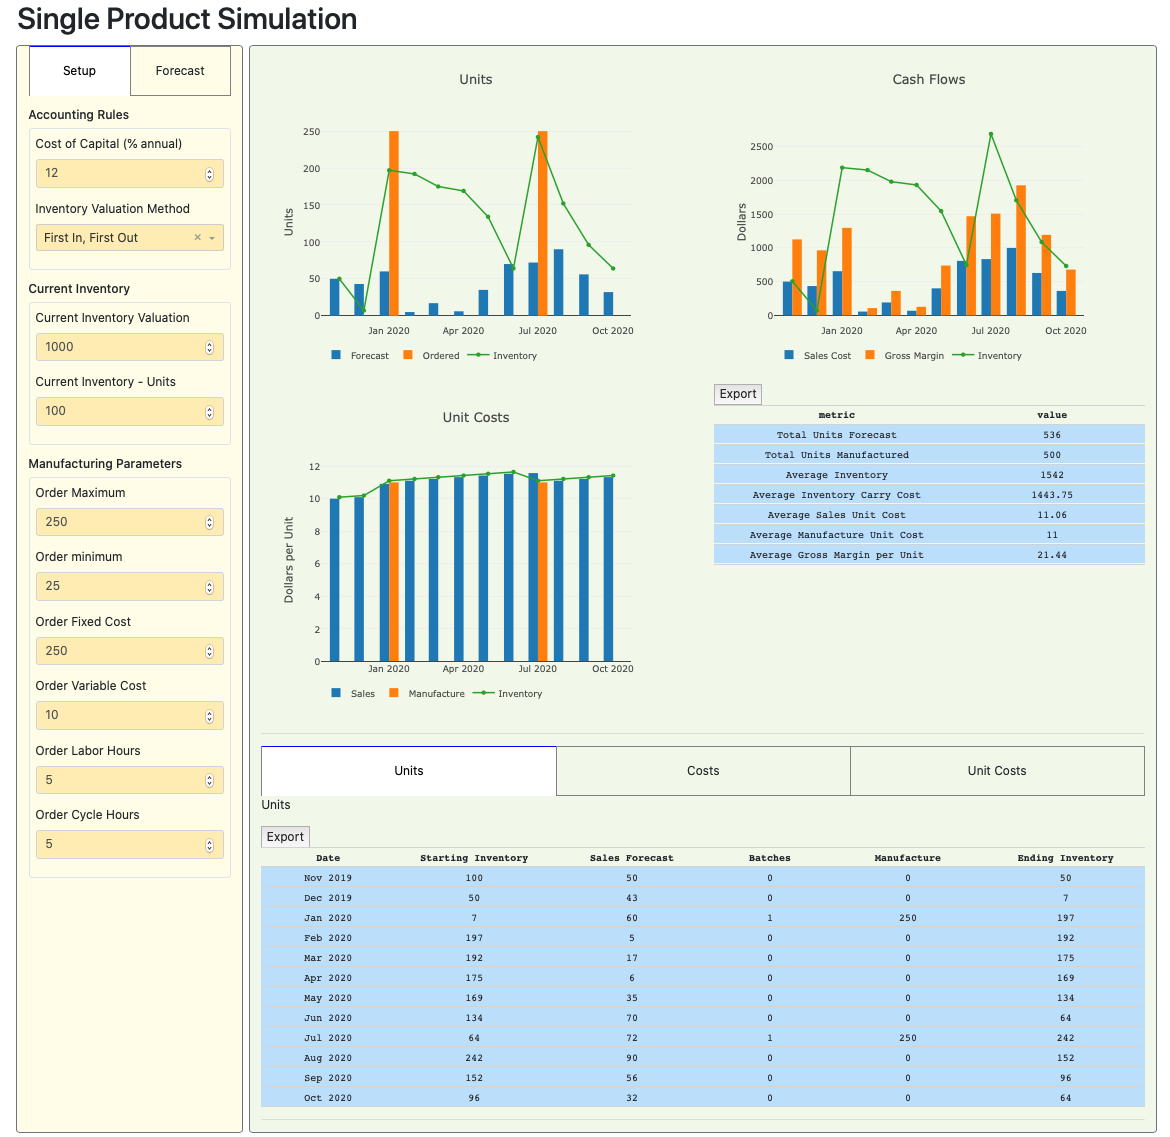
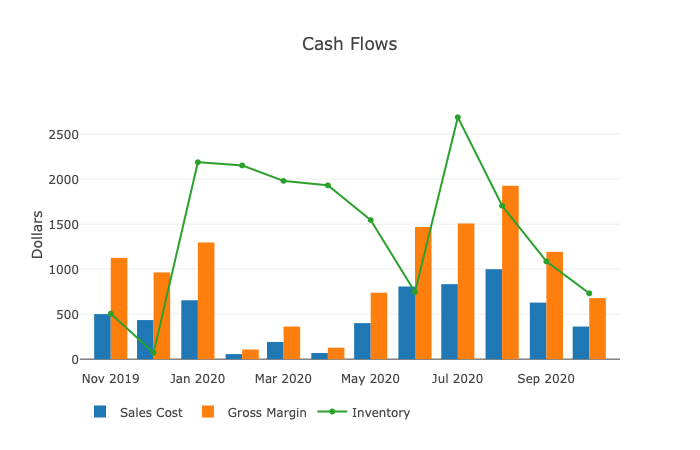
Working Capital, Profits, and Cash Flows

How much inventory do we expect to have on the shelf? When does this turn profitable? If we order in bigger batches, what does that do to our cash?

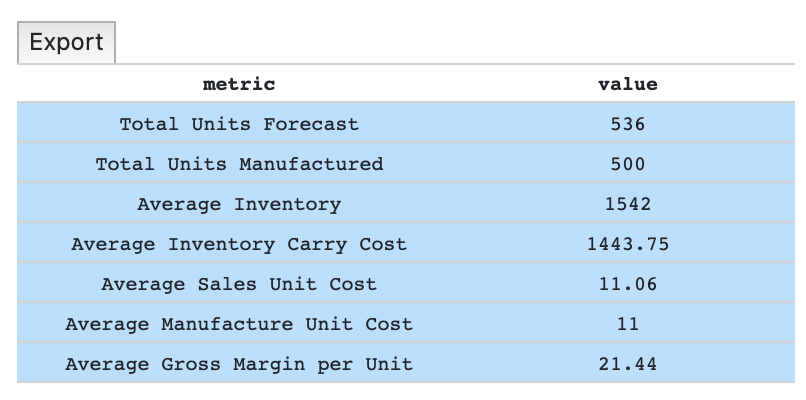
Graphically get a look at how cash moves thorugh the system, starting in manufacturing and ending in gross margin. See how units move though the system for capacity planning and warehouse usage. Get up close to unit costs and cost creep to get a handle on profitability.

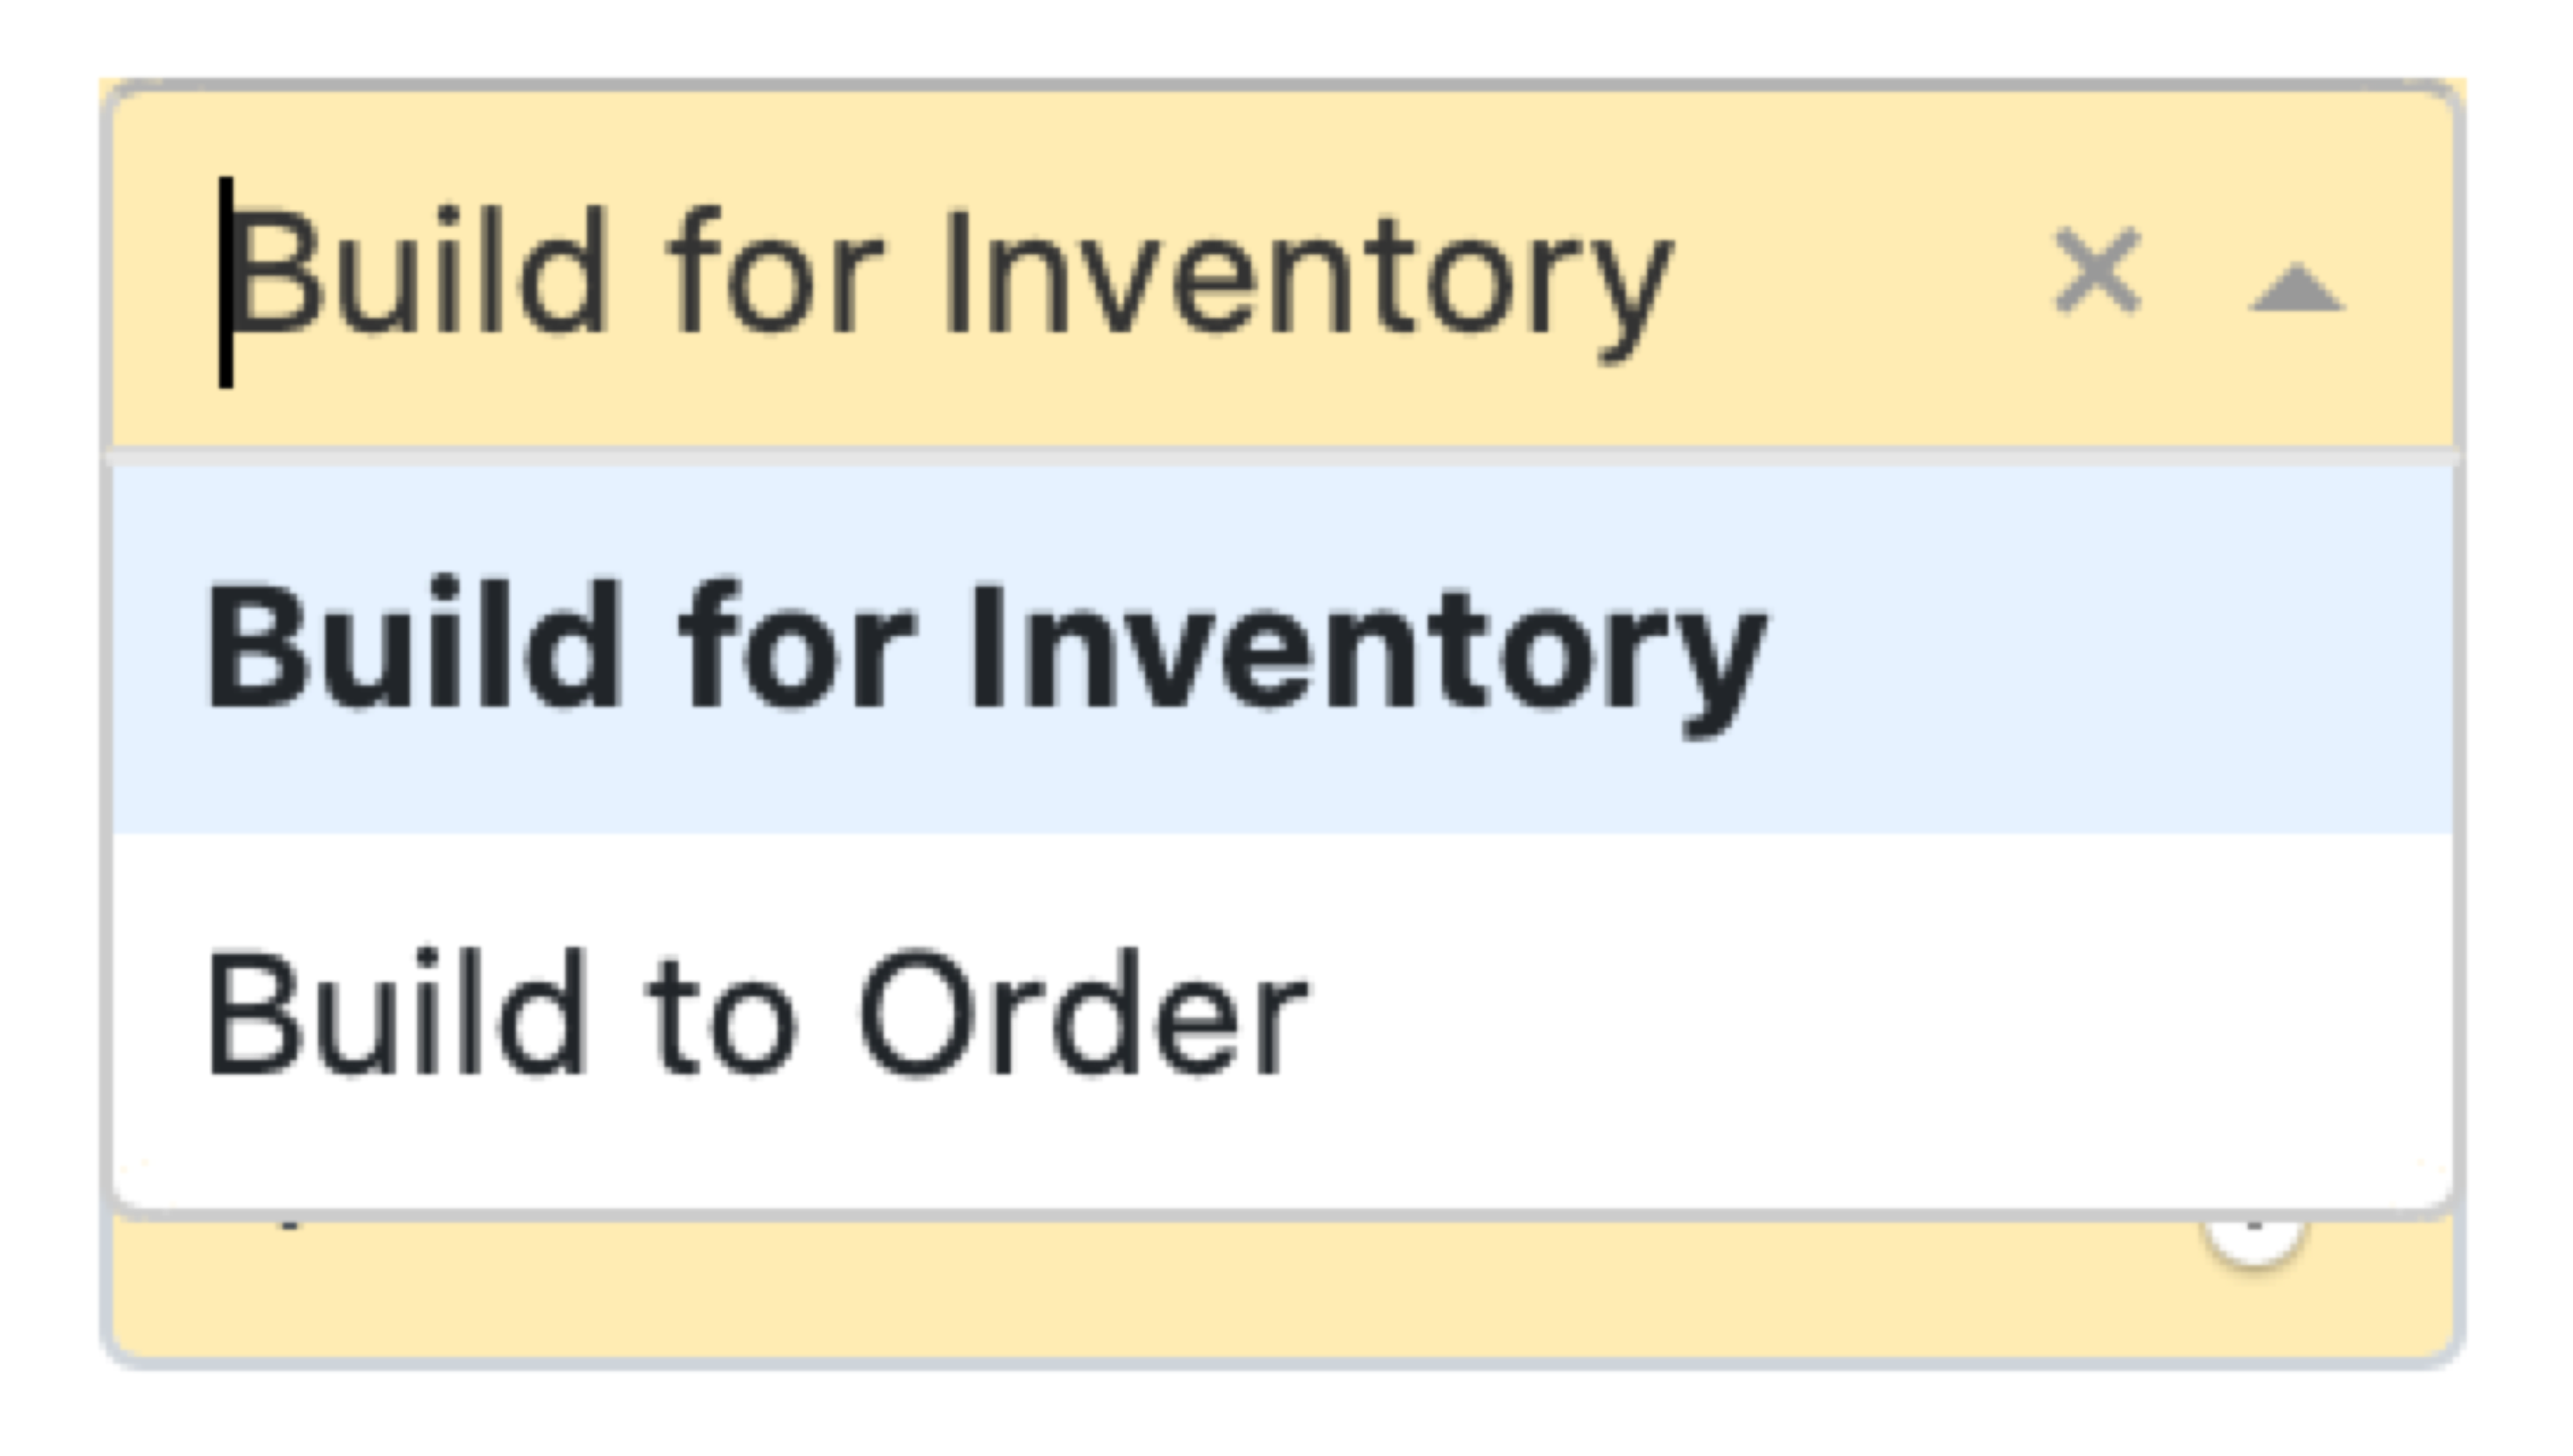
Card image of button showing build to order and build to stock
MTO vs MFS

Do you want to keep this in inventory? Do the holding costs outweigh the setup costs? Compare these differences with one click!

With one button, see the effects of Manufacture-To-Order versus Manufacture-For-Stock. Change variable costs and see how it affects cash flow. Thinking about an investment in new facilities? Run different scenarios side-by-side to see which is right for your organization.

Card image cap
Usability

  • Export tables to Excel
  • Reactive, exportable graphs
  • Can be integrated into your ERP system
Sitting in a meeting and want to move the screen from your laptop to the screen? The tool is reactive, and displays the same on a 13" laptop as on a 55" tv. Want to take a closer look at the data in Excel? We've get you covered with export directly to Excel. Need to put the graph in a sales presentation? All graphs can be zoomed in and exported as png files. Do you want to run this in your monthly sales meeting? This can be tied into your ERP system and run either in Azure on on your servers to keep the data secure.