Drag and Drop Journal Converter
Project Description

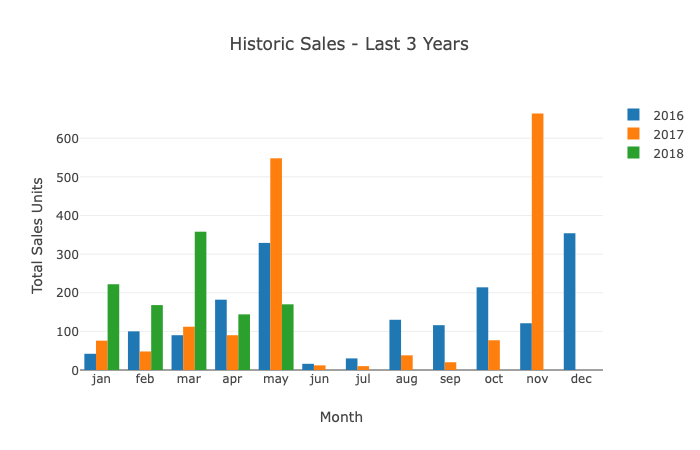
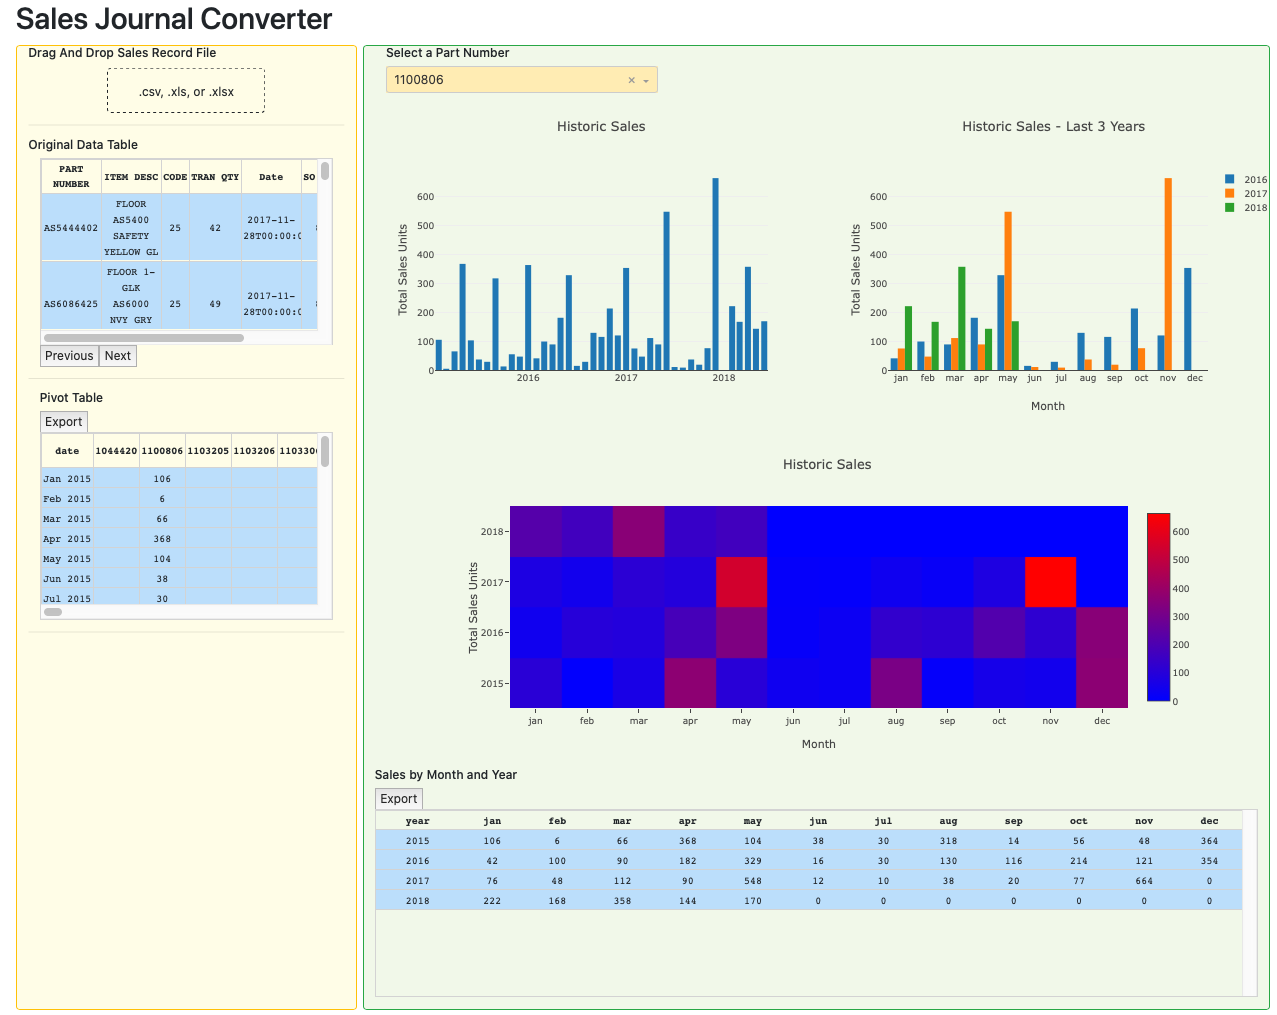
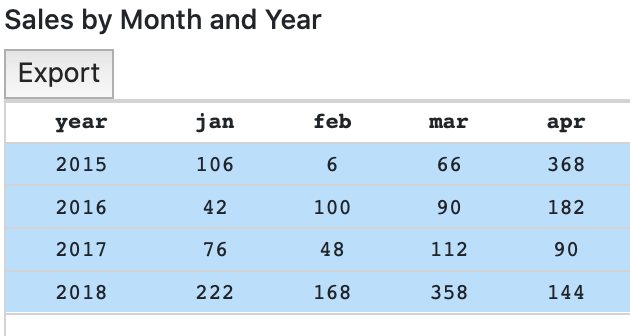
Every major accounting system has a table containing each invoice line item. This app identifies the data columns and pivots the data into a large table based on part number and month. Each part can then be viewed in multiple ways to gain insight. A historical trace, a month-by-month overlay, and a heatmap showing high and low sales months are displayed. The data can be saved as a Microsoft Dynamics history file or exported to Excel for further analysis.

Use Cases

  • Review sales history from obsolete systems
  • View sales trends graphically in multiple formats
  • Create a Sales History file for Dynamics
  • Export to Excel for further analysis
Insights

Card image cap
Drag and Drop

Drag and Drop your sales journal in an Excel or CSV file format, and the app does the rest.

The file only has to have the following columns (although it can have more), and it will find the data and put it in the right place:

  • Date in any format
  • Part Number
  • Sales Quantity

Card image of button showing build to order and build to stock
Data Review

Select the part number, and see multiple views of the sales data.

  • Historical Sales by Date
  • Last three years as an overlay
  • Heatmap to quickly see hot months or years

Card image cap
Usability

Export the history in a format to include the history in Dynamics. Open the file in Excel for further analysis

  • Export tables to Excel
  • Reactive, exportable graphs
  • Can be integrated into your ERP system